Where Did the Sprint Go? The Hidden Cost of Debugging Work That Should Never Have Existed
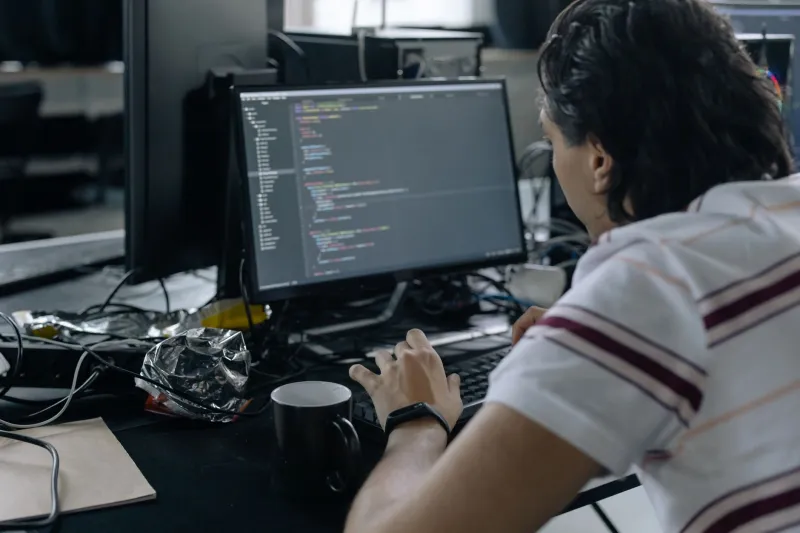
Every engineering manager has lived through the same sprint retrospective. The team planned eight story points of feature work, delivered maybe four, and spent the rest of the time chasing down a production bug that nobody saw coming. The post-mortem reveals the usual suspects: a log that wasn't verbose enough, a metric that wasn't being tracked, an alert that fired too late — or didn't fire at all.
That's not bad luck. That's a systemic infrastructure problem, and it has a price tag most teams never actually calculate.
Let's do the math.
The 40% Number Isn't Hype
A widely cited Stripe developer survey found that software engineers lose an average of 17.3 hours per week to technical debt and related issues — a category that includes debugging poorly instrumented systems. A separate analysis from the Consortium for Information and Software Quality estimated that low-quality software cost US organizations over $2.4 trillion in 2022 alone. Debugging time is one of the biggest contributors to that figure.
Break it down to sprint level: a two-week sprint for a mid-sized engineering team running 40-hour work weeks gives you roughly 80 person-hours per engineer. If 30–40% of that is absorbed by reactive debugging — chasing stack traces, manually correlating logs, re-running pipelines to reproduce flaky errors — you're looking at 24 to 32 hours per engineer, per sprint, that never touched the roadmap.
For a team of six engineers at an average US fully-loaded cost of around $150/hour, that's $21,600 to $28,800 per sprint. Per sprint. That's not a rounding error. That's a hiring budget.
Why So Much Debugging Is Preventable
Here's the frustrating part: a significant chunk of that time isn't spent on genuinely hard problems. It's spent reconstructing context that should have been captured automatically.
Three infrastructure gaps show up over and over again in post-mortems from open-source projects and enterprise teams alike:
1. Logging that describes what happened, not why.
A log line that says ERROR: process failed is technically a log. It's not useful observability. Without structured logging — capturing request IDs, user context, upstream dependency states, and payload metadata — engineers are left piecing together a timeline from fragments. The CNCF's observability working group has documented this as one of the most common gaps in production systems, including in mature open-source projects like Kubernetes operators and Apache Flink deployments.
2. Metrics without baselines. Dashboards are everywhere. Meaningful alerting thresholds are not. Teams that track CPU and memory but haven't established normal behavior ranges for their specific workloads end up with alert fatigue — or worse, silence. Both outcomes delay detection. OpenTelemetry adoption has helped close this gap in newer stacks, but legacy systems still routinely lack the instrumentation needed to distinguish a slow day from an actual incident.
3. Error tracking that stops at the surface. Tools like Sentry and Rollbar are widely adopted, but they're only as useful as the context they're given. Uncaught exceptions in data pipelines — the kind that silently produce wrong outputs rather than crashing loudly — often never show up in error trackers at all. The pipeline runs, the job completes, and nobody knows the results are wrong until a stakeholder catches a number that doesn't add up.
Calculating Your Own Debugging Tax
If you want to actually quantify this for your team, here's a lightweight framework worth running before your next planning cycle.
Step 1: Time-box audit. Ask every engineer on the team to log debugging time separately from feature work for one full sprint. Don't guess — track it. Most teams are surprised by how quickly it adds up.
Step 2: Classify the debugging. Separate incidents into two buckets: infrastructure-detectable (problems that better logging, metrics, or alerting would have caught or prevented) and genuinely novel (bugs that required human investigation regardless of tooling). Most teams find that 60–70% of their debugging time falls into the first bucket.
Step 3: Calculate the cost. Multiply your infrastructure-detectable debugging hours by your team's fully-loaded hourly cost. That number is your baseline debugging tax per sprint.
Step 4: Price the fix. Estimate the engineering effort required to implement structured logging, set up meaningful alerting baselines, and expand error tracking coverage. This is typically a one-time investment of two to four sprints for a team that hasn't done it before — with ongoing maintenance running maybe 5–10% of that annually.
For most teams, the math resolves quickly. The upfront instrumentation investment pays for itself within two to three sprints.
What Open Source Communities Figured Out
It's worth looking at how large open-source projects handle this, because they operate under constraints that make observability a necessity rather than a nice-to-have. Apache Kafka, Prometheus, and Grafana all have extensive contributor documentation on instrumentation standards — not because the maintainers are perfectionists, but because distributed contributors debugging production issues without context is simply untenable.
The Prometheus project, for example, has a defined convention for what metrics must be exposed by any component that wants to be considered production-ready. It's not optional. That kind of standard, applied internally to a product engineering team, would eliminate a significant percentage of the "what is this thing even doing" debugging time that shows up in sprint retrospectives.
The lesson isn't that you need to run your team like an open-source project. It's that communities which can't afford debugging overhead built cultures and tooling standards specifically to minimize it — and those patterns are directly applicable to product teams.
The Investment Case Is Straightforward
The reason teams don't prioritize observability infrastructure isn't that the ROI is unclear. It's that the cost is invisible. Nobody files a ticket that says "we spent 12 hours this sprint because our logs were bad." The time just disappears into the sprint, the velocity number comes out lower than planned, and the team moves on.
Making that cost visible — even roughly, through a one-sprint audit — tends to shift the conversation fast. When a team can say "we're losing approximately $25,000 per sprint to preventable debugging, and we could address the root cause in six weeks," the prioritization argument writes itself.
The debugging tax is real. It's measurable. And for most engineering teams, it's largely optional — if you're willing to invest in the instrumentation infrastructure that makes prevention possible.
The sprint you save might just be the one where you finally ship the thing that's been on the roadmap for three quarters.